Inventory Forecasting for Cross-Border Brands: Lead Times, Safety Stock and Days of Cover

Brands tend to treat forecasting as a prediction problem, which is why so much effort goes into better demand models and so little into the thing that actually causes stockouts. A forecast that is 15% out rarely breaks anything. A container that arrives three weeks late does, and the second happens far more often than the first. Cross-border selling makes this worse in a specific way: the longer your lead time, the further ahead you have to commit, and the more a small error in either direction costs you.
The short answer: forecast demand per market, size safety stock from lead time variability rather than from a rule of thumb, and manage to days of cover instead of units on hand.
Key takeaways
- Lead time variability causes more stockouts than forecast error does.
- Safety stock should be sized from how unreliable your supply is, not set as a flat percentage.
- Days of cover is the metric to plan with, because it is comparable across products of different values.
- Stock held in several countries has to be forecast per pool, since the pools cannot serve each other.
- Overstock is usually more expensive than understock once storage surcharges are counted.
Start with the metric, not the model
Units on hand tells you almost nothing on its own. Four hundred units is comfortable for one product and a crisis for another.
Days of cover is current stock divided by average daily sales. It converts every product onto the same scale, which is what makes a catalogue reviewable in one sitting. A SKU at 90 days of cover and one at 11 days are two different conversations, and you can see both at a glance.
Sell-through rate is units sold divided by units received over a period. It tells you whether a buying decision was right, which days of cover does not, and it is the number to look at when deciding reorder quantities for a product you have bought before.
Inventory turnover is the annual version of the same idea, and it is mostly useful for comparing your working capital efficiency over time rather than for deciding what to order on Tuesday.
The practical setup is a days-of-cover threshold per product that triggers a review, set from that product's own lead time rather than a single number across the catalogue. A SKU with a 90-day supply chain and a SKU shipped domestically in a week should never share a reorder point.
Lead time is the variable that matters most
Lead time is not the number your supplier quotes. It is the whole span from placing a purchase order to units being sellable, and the quoted figure is usually the smallest component.
Count it properly: production, quality checks, consolidation and booking, ocean or air transit, customs clearance, inland transport, receiving at the warehouse, and then the marketplace's own receiving time before stock goes live. On Amazon that last step alone can add days and sometimes weeks during peak, and it is the one most brands leave out of the calculation entirely. Our piece on how long customs clearance takes covers the border portion, which is routine when the paperwork is right and open-ended when it is not.
Then track the variance rather than the average. If your supply chain runs 60 days typically and 85 days occasionally, planning against 60 guarantees periodic stockouts regardless of how good the demand forecast is. The spread between typical and worst case is the number safety stock exists to cover.
Two practical habits follow. Record actual lead times on every inbound shipment, because most brands cannot say what theirs really is. And treat a changed route, a new supplier or a different port as a reset, since the historical variance no longer describes the new arrangement.
Sizing safety stock without guessing
Safety stock is protection against two kinds of uncertainty: selling faster than expected, and stock arriving later than expected. For most cross-border brands the second dominates.
A workable approach without statistical machinery: take your worst realistic lead time rather than your average, multiply by average daily sales, and compare that with your current cover. The gap is roughly what you need to hold. Then adjust for how bad a stockout actually is for that product, because the right answer is not uniform.
Where to hold more: products with a single supplier, long or variable lead times, strong organic rank that a stockout would damage, and anything where running out triggers a marketplace penalty. On Amazon, stockouts cost ranking and can trigger low-inventory fees, which makes the real cost higher than the lost sales alone, as our breakdown of the 2026 fee stack sets out.
Where to hold less: short lead times, several supplier options, high storage cost per unit, and anything seasonal or perishable where leftover stock loses value rather than waiting patiently.
One trap worth naming. Safety stock held in the wrong country is not safety stock. It is capital tied up in a place that cannot serve the demand you are protecting against.

Forecasting per pool, not per brand
This is where cross-border planning stops resembling the textbook version.
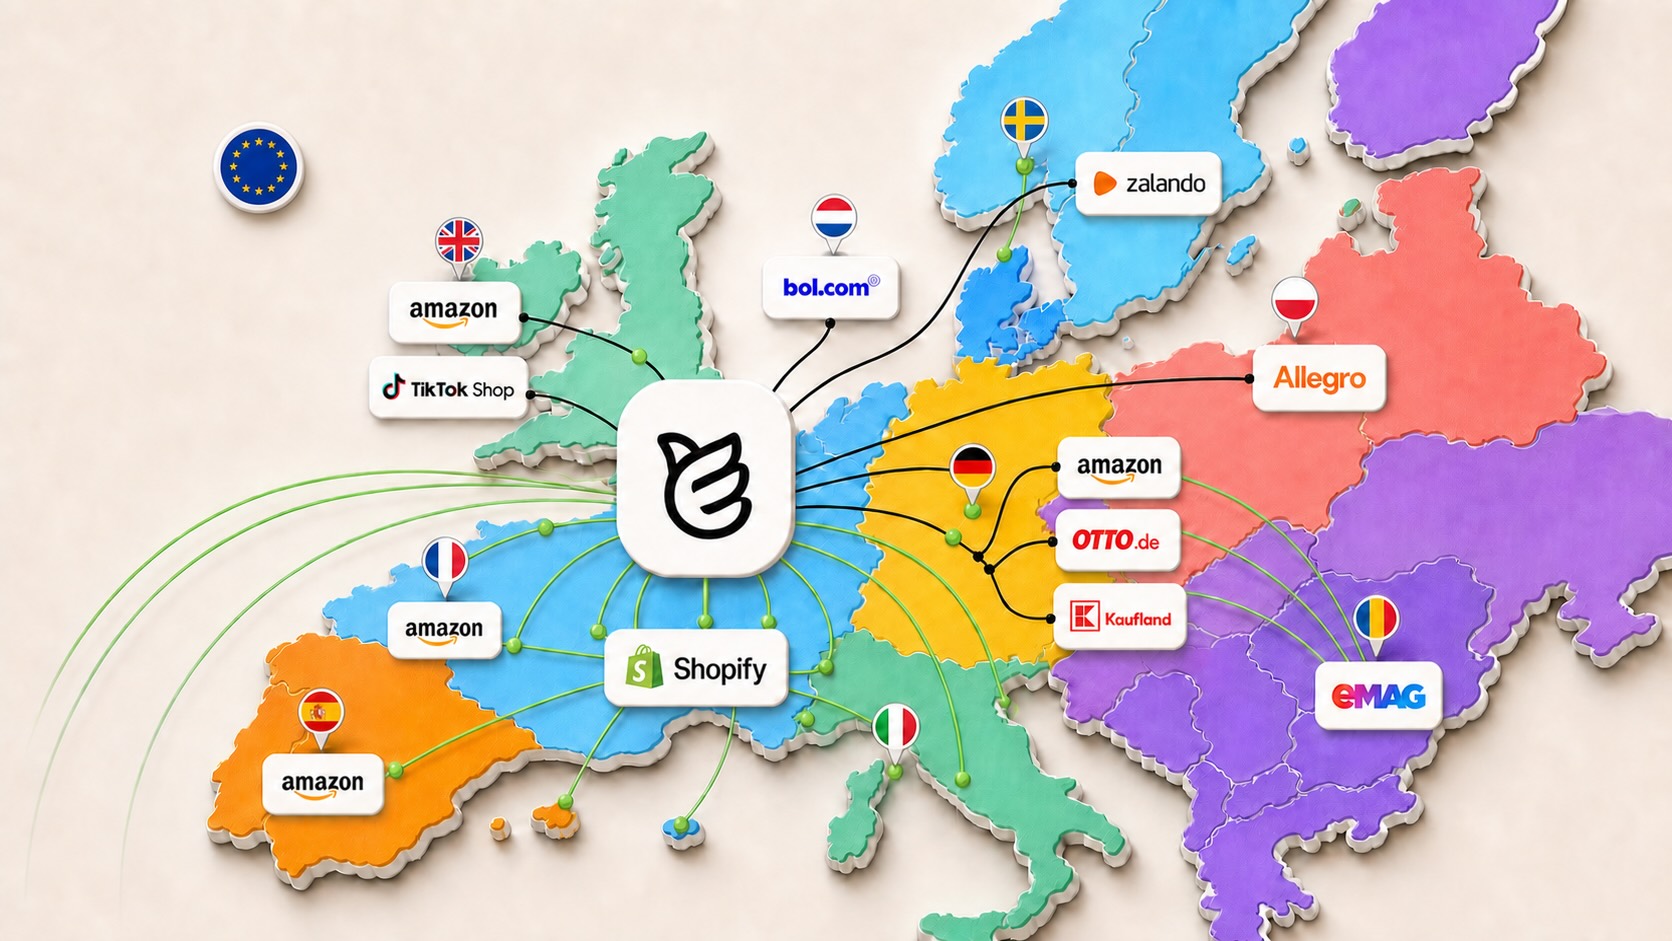
A brand selling across the US and Europe on several channels does not hold one inventory. It holds separate pools that cannot substitute for each other without freight and customs: an Amazon US fulfilment network position, a European 3PL position, perhaps a Walmart network position, perhaps stock distributed across EU countries under Pan-EU. We cover why those pools stay separate in our piece on multi-channel inventory management.
Three consequences for planning. Each pool needs its own demand forecast, because channel mix and seasonality differ by market and a blended figure hides both. Each pool needs its own safety stock, which ties up more capital for the same service level than a single-market brand needs. And the allocation decision, how much of an inbound shipment goes where, is a commitment rather than a preference, since moving units between pools later costs freight and sometimes duty.
The error that follows from ignoring this is familiar: a brand with plenty of total stock, out of stock in its best market, holding six months of cover somewhere it is not selling. Totals look healthy and the business is losing sales.
Returns add a smaller complication in the same direction. Returned units re-enter the pool they came from, in a condition that needs grading before they count as sellable, which is one more reason the returns operation belongs in the inventory picture rather than beside it.
Planning around peak
Peak season breaks forecasts in a predictable way: the commitment has to happen months before the demand signal arrives, and the cost of being wrong rises in both directions at once.
Order too little and you miss the only weeks of the year when demand exceeds supply. Order too much and the surplus sits through Q4 storage surcharges, then into the aged-inventory bands that both Amazon and Walmart apply, and finally into a markdown. The asymmetry people assume, that overstock is the safer error, often does not hold once storage and aged-inventory charges are counted, which is why dead stock is expensive in a way that is easy to miss on a balance sheet.
Three things help. Lock inbound capacity early, because freight gets both more expensive and less reliable approaching peak. Build the plan on last year's actuals by week rather than by month, since the shape within Q4 matters more than the total. And set a markdown trigger in advance, by date, so the decision to clear is taken while the stock still has value rather than in February.
What makes forecasts fail in practice
Rarely the model. Usually one of these.
Forecasting on channel-reported sales rather than demand, so periods when you were out of stock read as low demand and the next order repeats the shortage. Ignoring promotions, where a discounted week is used as a baseline for a normal one. Using global averages for a SKU that sells quite differently in two markets. And nobody owning the number, which is the most common failure of all: the forecast exists in a spreadsheet, the purchase order gets placed from a different conversation, and the two are reconciled only after something goes wrong.
Most of those are fixed by measurement rather than sophistication. A brand that records actual lead times, separates promotional weeks from baseline, and plans per market will outperform one with a better algorithm and worse inputs.
Where this sits operationally
Forecasting touches finance, buying, logistics and channel management, which is why it tends to be done partially by everyone and owned by nobody. The practical requirement is a single view of what is in each pool, what is sellable after reservations and returns, what is in transit, and what each market is actually selling, which is the picture Apollo Intelligence exists to give the brands we operate.
It also connects back to cost. The landed cost of a unit determines how expensive it is to hold, and the fulfilment model you choose for each SKU determines where it has to sit and what storage costs. Those are the same decision viewed from different angles, which is why forecasting improves when the people holding the stock and the people holding the numbers are the same operation.
eBrands runs that layer for the brands we work with, holding in-market stock positions, the fulfilment relationships and the channel data in one place while the inventory stays owned by the brand. If your total stock looks healthy and your best market keeps running dry, that is a pooling and allocation problem rather than a buying one, and our team can help you see it per market.
Frequently asked questions
What is inventory forecasting?
Predicting how much stock you need, where, and by when, so you can place purchase orders early enough to arrive before you run out. It combines demand forecasting with lead times and safety stock.
What is days of cover?
Current stock divided by average daily sales, giving the number of days your inventory will last at current velocity. It is more useful than units on hand because it compares products of different values and sales rates on one scale.
How much safety stock should I hold?
Enough to cover the gap between your typical and worst realistic lead time at current sales velocity, adjusted upward for single-source products and for channels where stockouts damage ranking or trigger fees.
Why do I keep running out despite ordering enough?
Usually lead time rather than quantity. Planning against an average lead time when the real one varies guarantees periodic stockouts. The other common cause is holding stock in a pool that cannot serve the market selling it.
Is overstock better than understock?
Not necessarily. Overstock carries storage costs, aged-inventory surcharges on marketplace networks, and eventual markdowns, while understock costs lost sales and ranking. For slow-moving products the overstock error is often the more expensive one.

“ We are dedicated to assisting you; please contact us for any information or inquiries you may have. ”