Amazon Brand Analytics: What Each Report Actually Tells You to Do

Amazon Brand Analytics is free, it comes with Brand Registry, and most brands that have it have never opened it. The ones who do tend to look at the brand-level summary, note that share of voice went up or down, and close the tab.
That is a shame, because one of these reports tells you exactly where in the funnel you are losing a specific search term — whether the problem is your main image, your detail page, your price or your stock position — and it does it per query, per ASIN, across the whole marketplace rather than just your own campaigns. No paid tool gives you that, because the data is Amazon's.
Here is what each report is for, how to read the one that matters, and where the numbers will mislead you if you take them at face value.
Key takeaways
- Brand Analytics is free with Brand Registry. There is no paid tier and no upsell.
- Search Query Performance is the one that changes decisions. It shows your share of impressions, clicks, cart adds and purchases for each query, against the whole marketplace.
- Where your share drops between two funnel stages tells you which fix to make — creative, detail page, or Buy Box and stock.
- SQP combines organic and paid with no spend or campaign attribution, so it diagnoses but never explains why.
- Repeat Purchase Behavior is the report that should set your advertising ceiling, and almost nobody uses it that way.
- Weekly query data is noisy. Treat three consecutive weeks moving the same way as signal, not one.
What is Amazon Brand Analytics, and who gets it?
Brand Analytics is a set of reports inside Seller Central, under Brands, available to sellers with an approved Brand Registry enrolment. Access is per brand, it costs nothing, and every report exports to CSV.
What makes it different from every third-party analytics tool is the denominator. Your advertising reports tell you what happened in your campaigns. Brand Analytics tells you what happened in the category — how many people searched a term in total, how many clicked anything, and what proportion of all of that was yours. You are seeing your share of a market, not your performance in a vacuum.
That is also why it cannot be replicated. Tools can estimate search volume; only Amazon knows how many shoppers who searched "beard oil" bought anything at all that week.
The reports, and what each one is for
Availability and exact metric names vary by marketplace, and Amazon adjusts the set without announcement, so check what your account actually shows rather than assuming the full list.
Search Query Performance: the only one most brands need
SQP gives you four funnel stages for every search query — impressions, clicks, cart adds, purchases — and for each stage three numbers: the marketplace total, your count, and your share as a percentage. It also gives marketplace-wide conversion rates at each step, and the median price and shipping speed of the products shoppers actually engaged with.
That last detail is quietly valuable. If the median price of products being clicked on your main query is €24 and you are at €39, you have learned something about why your click share is poor that no amount of listing optimisation will fix.
The diagnostic logic is simple: find the stage where your share drops, because that is where the problem is.
That last row is worth dwelling on, because it is where unauthorised sellers show up as a number rather than a suspicion. If cart adds are healthy and purchases are not, and your Buy Box share is patchy, you are filling other sellers' baskets on your own listing — the problem we cover in stopping unauthorised sellers.
There is also a useful rule for advertising. Where your purchase share sits well below your impression share, and the marketplace purchase rate for that query is at or above your catalogue norm, the term is converting for someone — move it into exact match with its own bid rather than leaving it in a broad campaign. The margin logic for setting that bid is in how to set ACoS and TACoS targets.

Repeat Purchase Behavior decides what you can pay for a customer
This report is three clicks away and almost universally ignored, and it answers a question most brands guess at: what is a customer actually worth?
It shows, per ASIN, the share of customers who bought again within 90, 180 or 365 days. That is a real repeat rate from real orders, not a modelled estimate — and it converts directly into an advertising ceiling. A product where 35% of buyers return within a year can justify an acquisition cost that would be reckless for one where 4% do.
Most brands set a single ACoS target across the catalogue. Repeat Purchase Behavior is the evidence for why that is wrong: your consumable SKU and your one-off SKU should not be bid at the same ceiling, and this report tells you by how much they differ.
It also tells you something strategic. A high repeat rate on a product you had assumed was a one-off purchase is usually a signal to test Subscribe & Save, a multipack, or a larger size — the demand is already repeating without you making it easy.
What Brand Analytics will not tell you
Worth being clear about, because the gaps are where people misread it.
It does not separate organic from paid. SQP combines both, and carries no spend, CPC or campaign attribution. So a rising impression share might be excellent organic ranking or an expensive bid war, and the report cannot tell you which. Cross-reference your Sponsored Products search term report before concluding anything about efficiency.
It is not real-time. Data lands after the period closes, weekly at best. It is a review input, not something to react to daily. Use advertising reports for daily tactics.
It does not cover AI-driven discovery. Shoppers finding products through Rufus or other assistive surfaces are not broken out, so a growing share of discovery sits outside the report entirely.
It names the stage, not the cause. SQP narrows four possible problems to one. It does not tell you whether your click share is poor because of the image, the price or the reviews — that still needs you to look at the results page.
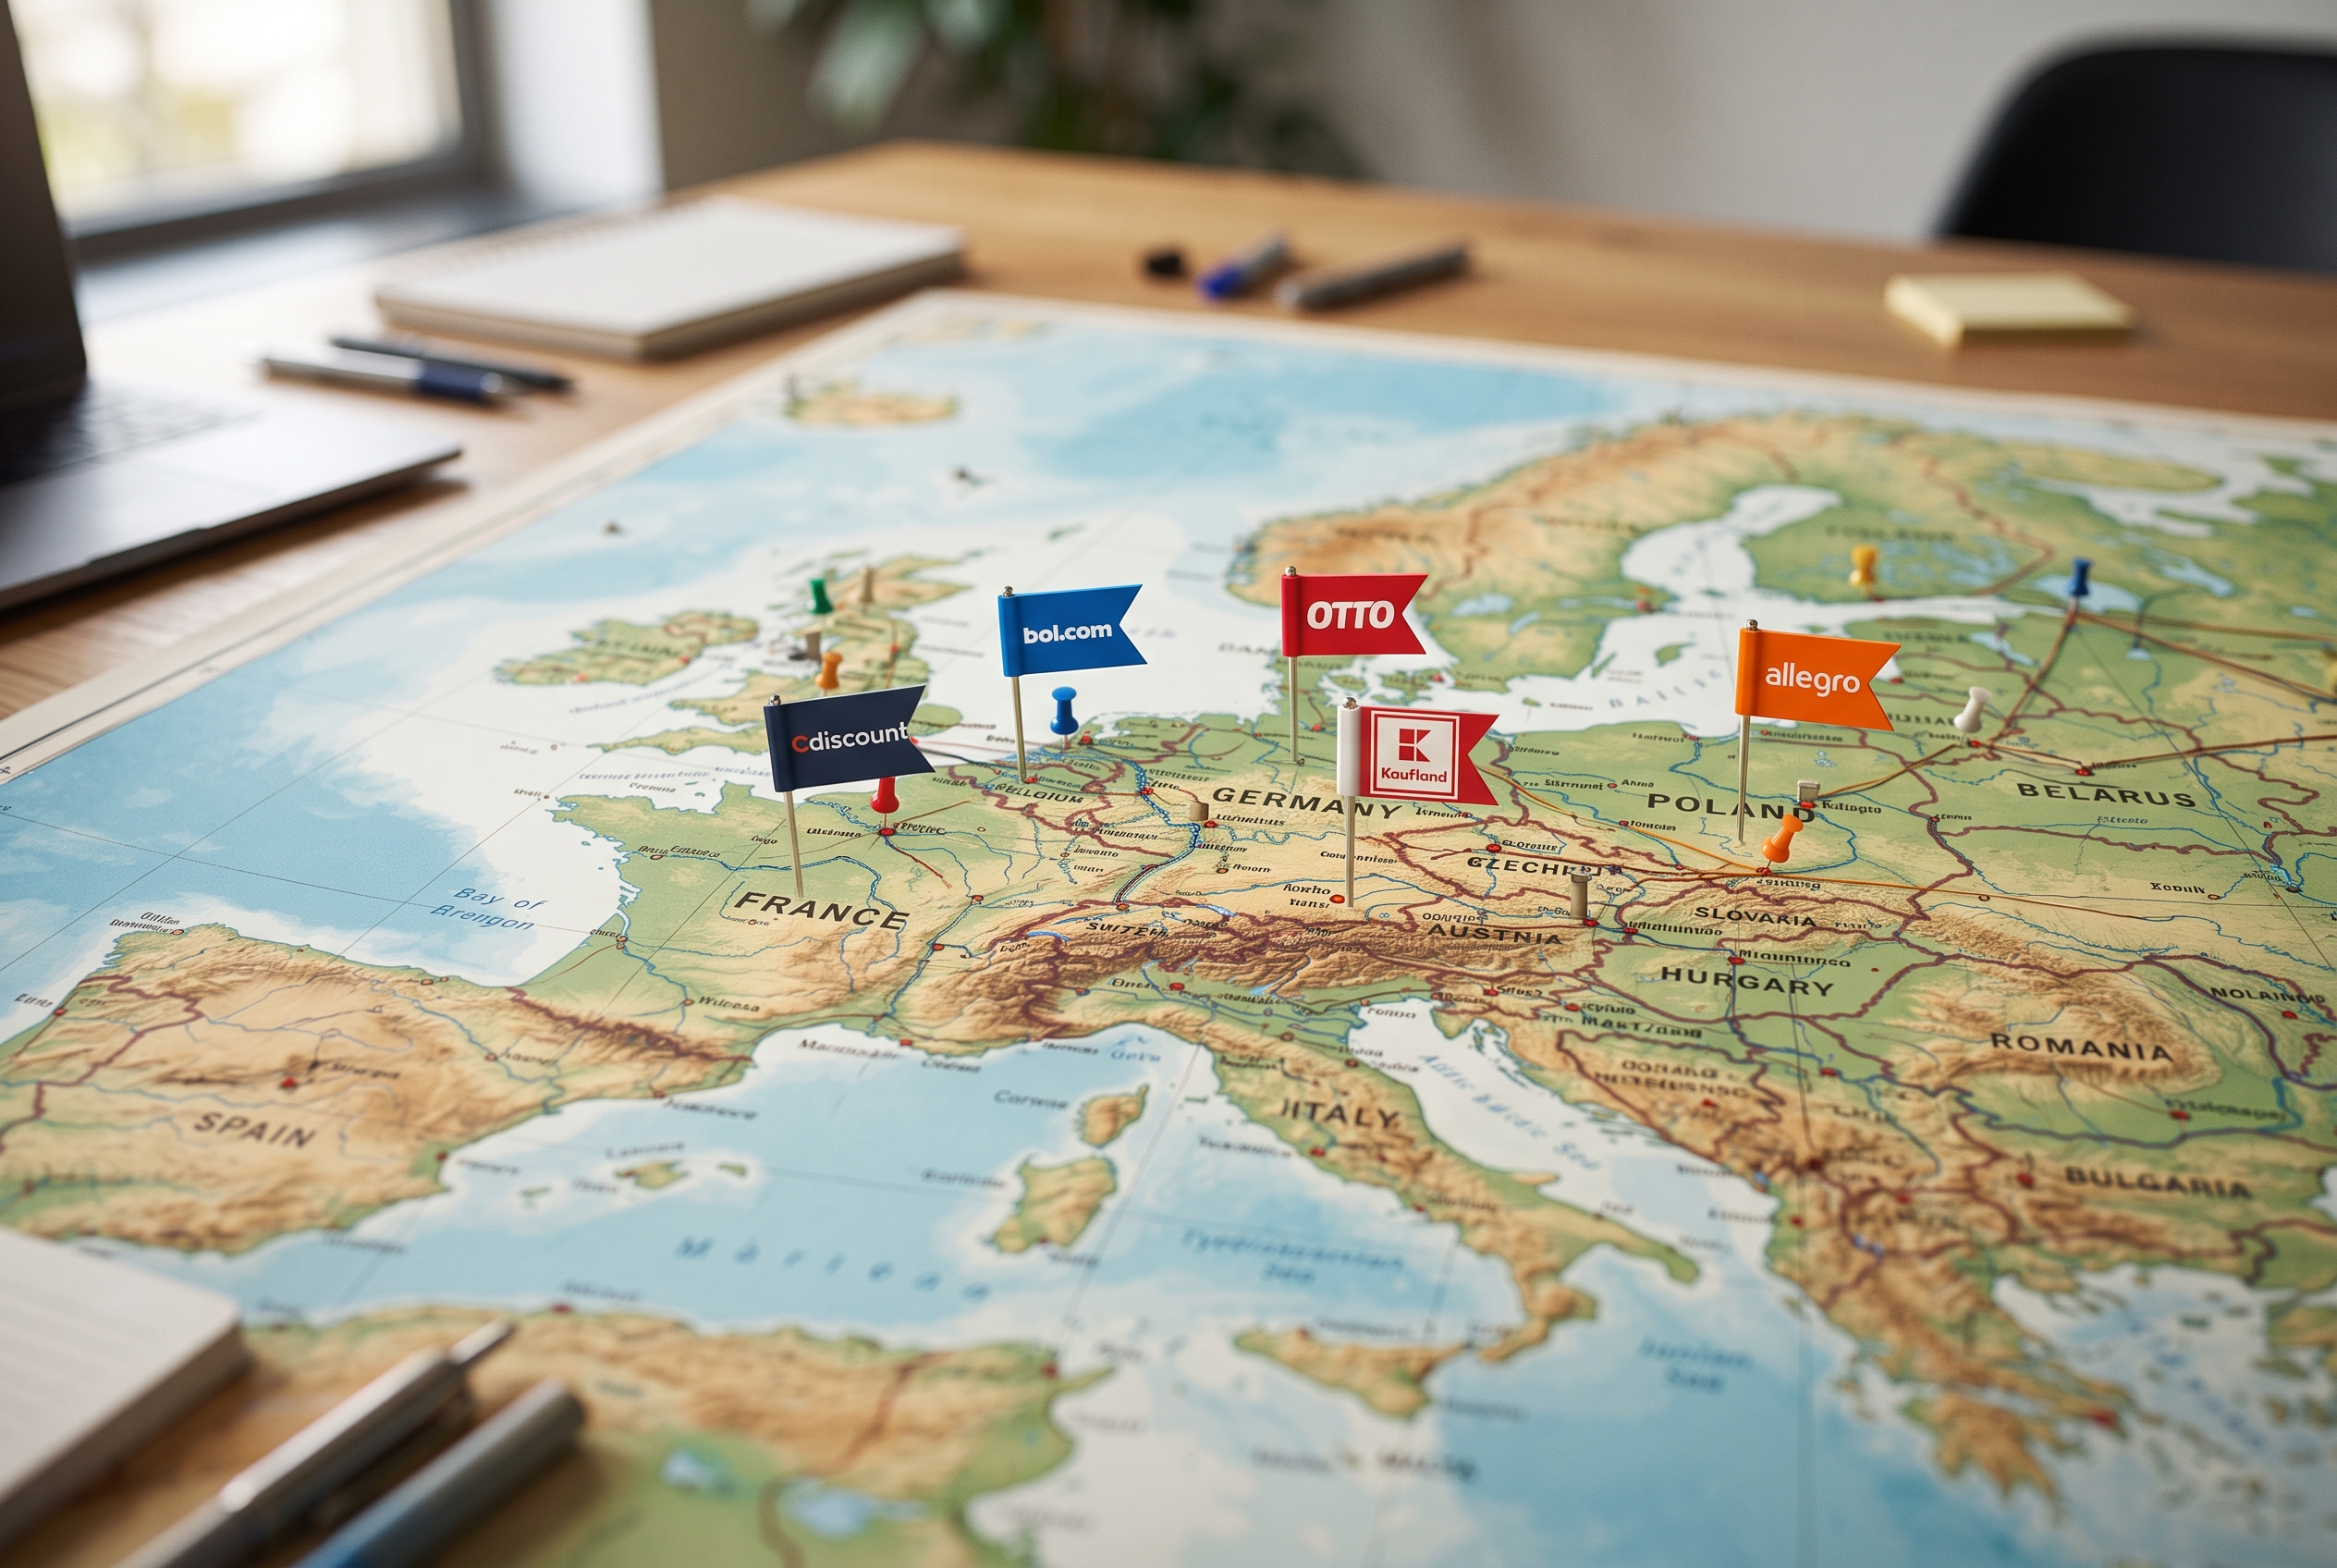
Coverage varies by marketplace. Running the same analysis across several European marketplaces means checking what each one actually reports rather than assuming parity.
How to read it without fooling yourself
Three weeks, not one. Weekly query-level data is noisy enough that a single week's movement is usually nothing. Treat three consecutive weeks moving the same direction as signal.
Sum the counts, don't average the percentages. Averaging share percentages across queries weights a 40-search term the same as a 40,000-search term and produces a number that means nothing.
Reconcile the query set before reading a change. Which queries appear shifts week to week. A share that "dropped" may simply be measured against a different set of terms than last week's.
Start with the ASIN view, not the brand view. The brand-level summary is the one everyone opens and the one that hides everything — your worst ASIN and your best average out into a number that looks fine. The ASIN and query views are where findings live.
Frequently asked questions
Is Amazon Brand Analytics free?
Yes, for sellers with approved Brand Registry enrolment. There is no paid tier. Registry itself is free and requires a registered trademark.
What is the difference between Brand Analytics and Search Query Performance?
Search Query Performance is one report within Brand Analytics — generally the most useful one. Brand Analytics is the whole suite, which also includes Search Catalog Performance, Repeat Purchase Behavior, Market Basket Analysis, Demographics and Item Comparison.
How often does Search Query Performance update?
Data is available in weekly, monthly and quarterly buckets, landing after each period closes. There are no custom date ranges, and there is a lag, so treat it as a review tool rather than a live dashboard.
Can I get Brand Analytics data through an API?
Search Query Performance is available through Amazon's SP-API Brand Analytics reports, which lets larger brands automate weekly exports. Some reports, such as Demographics and Market Basket, are typically CSV-only from the interface.
Does Brand Analytics show my competitors' sales?
Not directly. It shows which ASINs win share of clicks and purchases for a given query, which tells you who is beating you on that term and by how much proportionally — but not their revenue. Third-party sales estimates remain estimates.
My share of voice went up but sales are flat. What does that mean?
Usually that the category grew and you grew with it, or that you gained impressions without gaining purchases. Check whether the marketplace totals for your main queries rose over the same period. Share is a ratio, and both halves of it move.
Where this fits
Brand Analytics is the closest thing Amazon gives you to seeing the category rather than your corner of it — and it is free, which makes the fact that it mostly goes unread the easiest problem on this list to fix.
The limitation is scope. It tells you about one marketplace, from inside Seller Central, with no view of what the same brand is doing on other channels or what any of it costs to serve. eBrands operates Amazon alongside twenty other marketplaces, D2C and retail as the seller and importer of record, and Apollo Intelligence is where those channels resolve into one view of what actually produced margin.

“ We are dedicated to assisting you; please contact us for any information or inquiries you may have. ”